- UID
- 379260
- 热情
- 151
- 人气
- 384
- 主题
- 49
- 帖子
- 141
- 精华
- 6
- 积分
- 377
- 分享
- 0
- 记录
- 0
- 相册
- 0
- 好友
- 0
- 日志
- 0
- 在线时间
- 239 小时
- 注册时间
- 2014-4-30
- 阅读权限
- 20
- 最后登录
- 2015-7-16
 
升级    59% 59% - UID
- 379260
- 热情
- 151
- 人气
- 384
- 主题
- 49
- 帖子
- 141
- 精华
- 6
- 积分
- 377
- 阅读权限
- 20
- 注册时间
- 2014-4-30
|
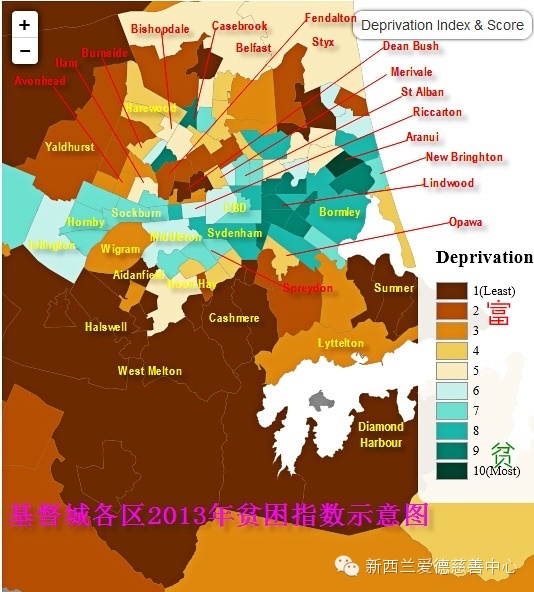
爱德:这是个有趣的题目,又有权威数据支持。小编自己制作了基督城各区贫困指数分布图,很能说明基督城各区人口收入的状况,对您选择居所,投资置产不失是个清晰的指引,大家珍藏并转发哦!
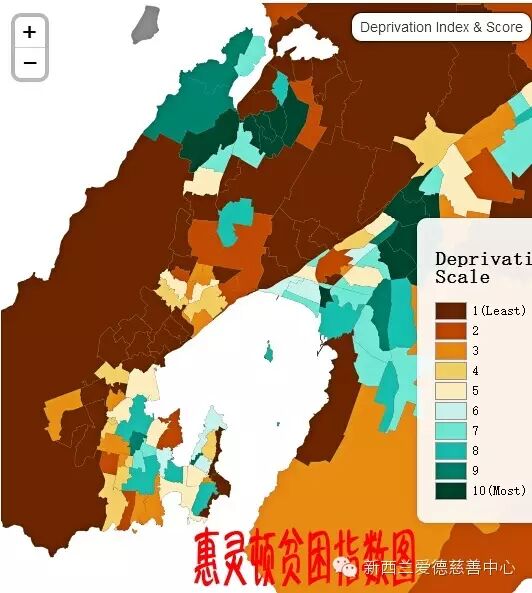
顺便也发一下奥克兰和惠灵顿的图,只是没功夫详细标示各区了。记得点击图像就可看大图了~喵
本文下部有 NZ Herald 的英文报道原文和到多媒体地图的链接,大家可以仔细参考哦。
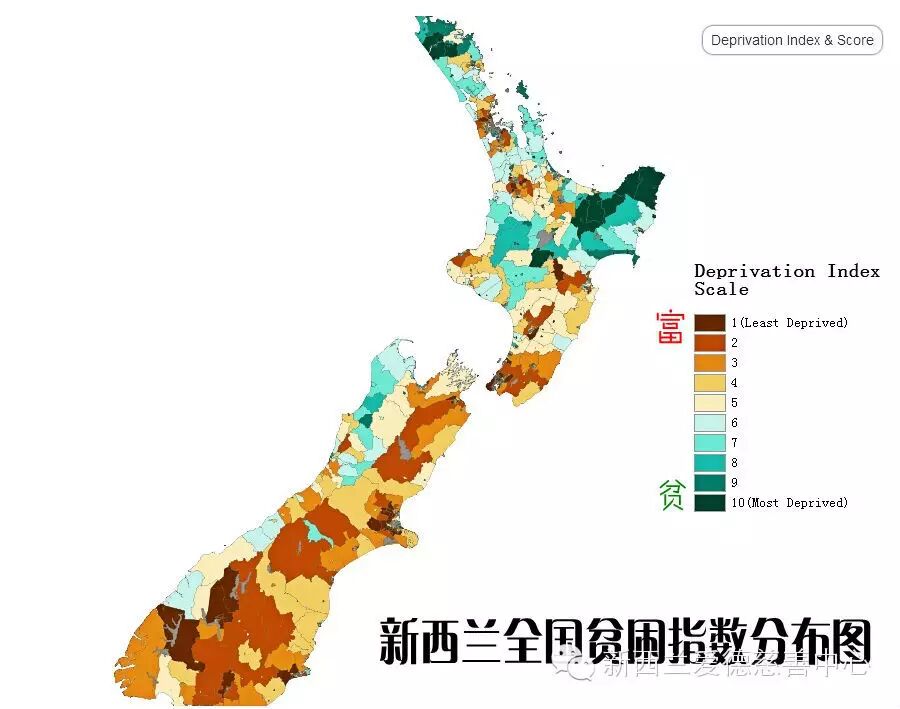
援引NZ Herald消息 日前,奥塔哥大学公布了新西兰贫困指数。通过对2013年人口普查数据进行深度分析,研究出新西兰各地贫困和富裕人口的分布。
在今年的报告中,研究者新增了65岁以下人士在家接入互联网的选项。
相关结果显示,自从指数首次制作以来,毛利族裔的贫困状况整整20年没有太大变化。研究者Peter Crampton教授说,大部分毛利人和太平洋岛民仍然生活在贫困地区。要改变这一现状,可能需要几代人的时间。
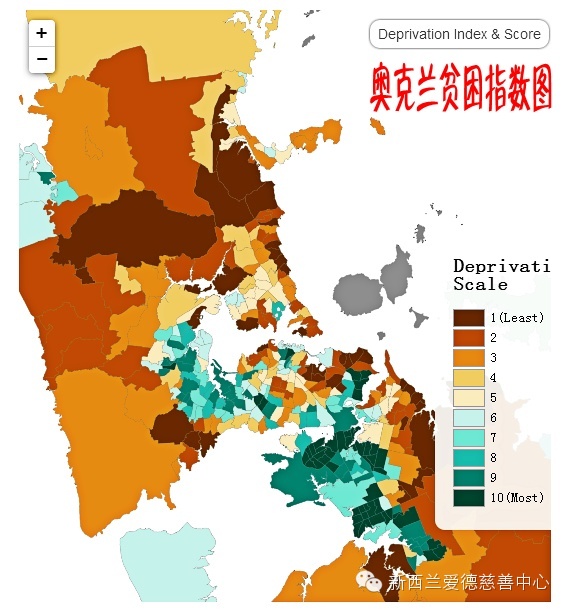
而根据RadioNZ报道,奥克兰的各区贫富差距正在拉开。在2006年普查时,奥克兰年收入中位数最高的是Orakei(包括Mission Bay和St Heliers),为36,600纽币,收入最低的Mangere-Otahuhu为19,900纽币。到了2013年普查,Orakei地区收入中位数增加到42,700纽币,Mangere-Otahuhu则减少到19,700纽币。
Where are NZ's most deprived areas? (+interactive)http://www.nzherald.co.nz/nz/news/article.cfm?c_id=1&objectid=11254032
Changing the geography of poverty within New Zealand will take generations, according to health policy researcher Peter Crampton.
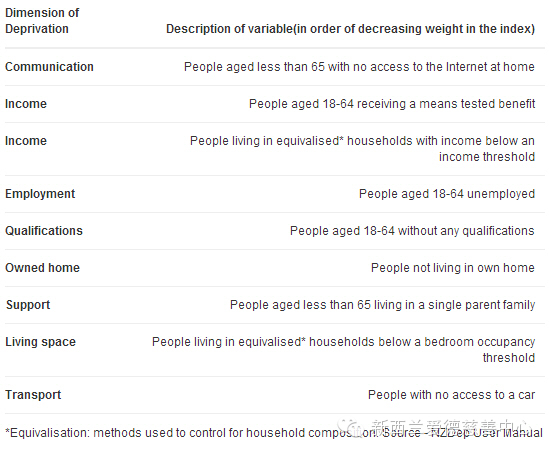
The New Zealand Deprivation index released last Friday provides an in-depth analysis from the 2013 census data. One noteworthy change in the index was the inclusion of 'lack of access to the Internet at home for those less than 65' variable.
The index shows the deprivation picture has remain unchanged for Maori 20 years since the first index was produced.
Professor Crampton said most Maori and Pacific people still live in socially deprived areas.
"I am struck and still taken aback by how ethnic patterns have remained stable.
"New Zealand is on a positive journey, but the underlying patterns remain. It will be a multi-generational process for things to change. We've to stay in the game and continue working through the process."
The different variables used for calculating the deprivation index include - communication, income, employment, qualifications, owned home, support, living space and transport.
These variables are used to describe the underlying concept of deprivation. All the variables in the index reflect 'a lack of something'.
The inclusion of 'internet access' variable is meant to reflect the ever-increasing importance of the Internet for various social activities.
Professor Crampton said the inclusion increased the overall explanatory power of the index compared to the 2006 one.
"The Internet is now a fundamental aspect of our structures of opportunity, both socially and in the market."
The Internet variable is currently restricted to those aged less than 65 because of the strong age-related cohort effect, which will diminish rapidly over coming years.
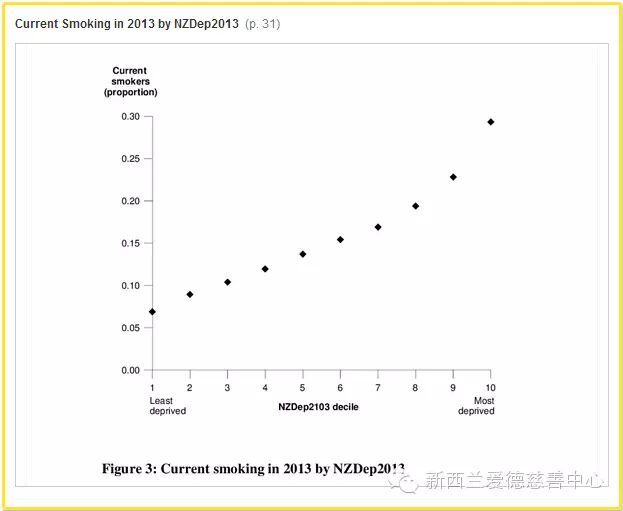
A value of 10 on the index of deprivation indicates that the area is in the most deprived 10 percent of areas in New Zealand.
The scale reflects a continuum from 'least deprivation' to 'most deprivation', rather than from 'affluence' to 'deprivation', according to the accompanying research report.
The latest index also shows that smoking is strongly correlated with the socioeconomic status.
The deprivation index is widely used in social service planning in central and local government. Its primary uses include resource allocation, research and community advocacy.
Professor Crampton emphasised the importance of remembering why the index was created in the first place.
"It is easy to see it as a labelling process which isn't helpful.'
来源:NZ Herald、天维网
 |
|


 发表于 2014-5-16 10:53:45
 分享
分享 收藏
收藏


